
Hello everybody,
I always have a window "ksysgard" in my session. I noticed something that looks like a bug: the system consumes "abnormally", but not always. I was not able to cause the problem for sure. I am relatively sure it's related to KMail. Once opened and closed KMail. The only window "KSysgard" is open.
It's strange because while preparing this e-mail, I re-opened KMail and opened Kate. Ksysgard was hidden. Deciding to watch the "consumption" while writing in kate, I de-masked Ksysgard: After this simple operation, consumption is re-lowered to a "normal" level ...
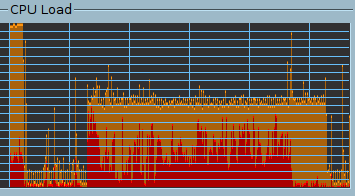
Comments on the attached picture: The vertical lines are spaced 60 seconds (1 sample per second) The horizontal lines are spaced 5% The left side (96% CPU load) represents the opening of the session, The following peaks represent the closure of all the windows and then opening and closing KMail Most of the picture represents this abnormal consumption On the left, back to "normal" situation.
I place this mail "users" list, because I dont want to repport a minor bug, if I'm the only one to see that. To you to confirm or deny...
System kubuntu 10.10-trinity-enterprise (86x_64)
Good luck to everyone, Patrick

Did you actually verify that it was that process which was KMail causing the issue by using "top" or ksysguard's process table?
Best regards, Tiago
On Tue, Oct 11, 2011 at 4:39 AM, Patrick Serru patrick@serru.net wrote:
Hello everybody,
I always have a window "ksysgard" in my session. I noticed something that looks like a bug: the system consumes "abnormally", but not always. I was not able to cause the problem for sure. I am relatively sure it's related to KMail. Once opened and closed KMail. The only window "KSysgard" is open.
It's strange because while preparing this e-mail, I re-opened KMail and opened Kate. Ksysgard was hidden. Deciding to watch the "consumption" while writing in kate, I de-masked Ksysgard: After this simple operation, consumption is re-lowered to a "normal" level ...
Comments on the attached picture: The vertical lines are spaced 60 seconds (1 sample per second) The horizontal lines are spaced 5% The left side (96% CPU load) represents the opening of the session, The following peaks represent the closure of all the windows and then opening and closing KMail Most of the picture represents this abnormal consumption On the left, back to "normal" situation.
I place this mail "users" list, because I dont want to repport a minor bug, if I'm the only one to see that. To you to confirm or deny...
System kubuntu 10.10-trinity-enterprise (86x_64)
Good luck to everyone, Patrick
To unsubscribe, e-mail: trinity-users-unsubscribe@lists.pearsoncomputing.net For additional commands, e-mail: trinity-users-help@lists.pearsoncomputing.net Read list messsages on the Web archive: http://trinity-users.pearsoncomputing.net/ Please remember not to top-post: http://trinity.pearsoncomputing.net/mailing_lists/#top-posting
On Tuesday 11 October 2011 23:50:31 Tiago Marques wrote:
Did you actually verify that it was that process which was KMail causing the issue by using "top" or ksysguard's process table?
Best regards, Tiago
--------------------------------------------------------------------- No, I did not. The real difficulty is that I am not able to cause the problem for sur. And because of that, I think that nobody will be "interested" by this problem. But I do not think that TOP can help with its display continually changing. Maybe is it possible to set the order, so that meets a monitoring function? The process table, with its filter on the name, might help, provided you have an idea of the name of the process involved. My machine is a desktop, I do not feel very concerned by this over-consumption...
Good luck to everyone, Patrick
NB: Today, I first wrote : « Worse: today, wanting to try TOP, I have not been able to reproduce the problem. In the previous report, there were only the opening and closing session TDE between two trials, no complete reboot. I want to conclude that this comes from X or Ubuntu (not TDE). X does not seem to work well (unexpected and azardeous X configuration changes on reboot) and my ATI card is not supported, while the drivers are installed... And I always loose a little more confidence in Ubuntu. I think it is wiser to forget this thread... » But finaly, I saw it again!

Il giorno 13-10-2011, alle ore 05:24, Patrick Serru patrick@serru.net ha scritto:
On Tuesday 11 October 2011 23:50:31 Tiago Marques wrote:
Did you actually verify that it was that process which was KMail causing the issue by using "top" or ksysguard's process table?
Best regards, Tiago
No, I did not. The real difficulty is that I am not able to cause the problem for sur. And because of that, I think that nobody will be "interested" by this problem. But I do not think that TOP can help with its display continually changing. Maybe is it possible to set the order, so that meets a monitoring function? The process table, with its filter on the name, might help, provided you have an idea of the name of the process involved. My machine is a desktop, I do not feel very concerned by this over-consumption...
Good luck to everyone, Patrick
NB: Today, I first wrote : « Worse: today, wanting to try TOP, I have not been able to reproduce the problem. In the previous report, there were only the opening and closing session TDE between two trials, no complete reboot. I want to conclude that this comes from X or Ubuntu (not TDE). X does not seem to work well (unexpected and azardeous X configuration changes on reboot) and my ATI card is not supported, while the drivers are installed... And I always loose a little more confidence in Ubuntu. I think it is wiser to forget this thread... » But finaly, I saw it again!
To unsubscribe, e-mail: trinity-users-unsubscribe@lists.pearsoncomputing.net For additional commands, e-mail: trinity-users-help@lists.pearsoncomputing.net Read list messsages on the Web archive: http://trinity-users.pearsoncomputing.net/ Please remember not to top-post: http://trinity.pearsoncomputing.net/mailing_lists/#top-posting
Try using htop, and playing with it's options. It's practically top with ncurses interface, which makes it easier to use.

On 13 October 2011 07:40, L0ner sh4dou@gmail.com wrote:
Il giorno 13-10-2011, alle ore 05:24, Patrick Serru patrick@serru.net ha scritto:
On Tuesday 11 October 2011 23:50:31 Tiago Marques wrote:
Did you actually verify that it was that process which was KMail causing the issue by using "top" or ksysguard's process table?
Best regards, Tiago
No, I did not. The real difficulty is that I am not able to cause the problem for sur. And because of that, I think that nobody will be "interested" by this problem. But I do not think that TOP can help with its display continually changing. Maybe is it possible to set the order, so that meets a monitoring function? The process table, with its filter on the name, might help, provided you have an idea of the name of the process involved. My machine is a desktop, I do not feel very concerned by this over-consumption...
Good luck to everyone, Patrick
NB: Today, I first wrote : « Worse: today, wanting to try TOP, I have not been able to reproduce the problem. In the previous report, there were only the opening and closing session TDE between two trials, no complete reboot. I want to conclude that this comes from X or Ubuntu (not TDE). X does not seem to work well (unexpected and azardeous X configuration changes on reboot) and my ATI card is not supported, while the drivers are installed... And I always loose a little more confidence in Ubuntu. I think it is wiser to forget this thread... » But finaly, I saw it again!
Try using htop, and playing with it's options. It's practically top with ncurses interface, which makes it easier to use.
I second this! Top is an archaic and terrible tool. htop is functional, fast, easy to view and use.

On Friday 14 October 2011, Calvin Morrison wrote:
I second this! Top is an archaic and terrible tool.
Hmm, I don't think this is very nice towards the people who wrote it.
Top may not be overly convenient for people who aren't used to command line tools, but if I want to see quickly which process hogs most of my CPU, Top tells me very quickly what I want to know.
Sanne
On Oct 14, 2011 7:17 AM, "Sanne" sanne@lavabit.com wrote:
On Friday 14 October 2011, Calvin Morrison wrote:
I second this! Top is an archaic and terrible tool.
Hmm, I don't think this is very nice towards the people who wrote it.
Top may not be overly convenient for people who aren't used to command
line
tools, but if I want to see quickly which process hogs most of my CPU, Top tells me very quickly what I want to know.
Sanne
I Disagree. I am a command line junkie. Top is archaic and if I recall hasn't been maintained much or improved in a decade. Utopia is dynamic, let's me veiw things faster easier, shows me more information especially for multi core processors and threads. Htop is better all around. anyway I'll leave it at that.
Try using htop, and playing with it's options. It's practically top with ncurses interface, which makes it easier to use.
Everyone!
I cannot encourage more to use this amazing application! top is out of the dark ages of unix.
use htop it rocks :-)
Calvin
</offtopic>
I was interested in this problem. Regardless of whether it is a desktop or a laptop, mindless consumption of system resources is worth looking into.
Best regards, Tiago
On Thu, Oct 13, 2011 at 4:24 AM, Patrick Serru patrick@serru.net wrote:
On Tuesday 11 October 2011 23:50:31 Tiago Marques wrote:
Did you actually verify that it was that process which was KMail causing the issue by using "top" or ksysguard's process table?
Best regards, Tiago
No, I did not. The real difficulty is that I am not able to cause the problem for sur. And because of that, I think that nobody will be "interested" by this problem. But I do not think that TOP can help with its display continually changing. Maybe is it possible to set the order, so that meets a monitoring function? The process table, with its filter on the name, might help, provided you have an idea of the name of the process involved. My machine is a desktop, I do not feel very concerned by this over-consumption...
Good luck to everyone, Patrick
NB: Today, I first wrote : « Worse: today, wanting to try TOP, I have not been able to reproduce the problem. In the previous report, there were only the opening and closing session TDE between two trials, no complete reboot. I want to conclude that this comes from X or Ubuntu (not TDE). X does not seem to work well (unexpected and azardeous X configuration changes on reboot) and my ATI card is not supported, while the drivers are installed... And I always loose a little more confidence in Ubuntu. I think it is wiser to forget this thread... » But finaly, I saw it again!
To unsubscribe, e-mail: trinity-users-unsubscribe@lists.pearsoncomputing.net For additional commands, e-mail: trinity-users-help@lists.pearsoncomputing.net Read list messsages on the Web archive: http://trinity-users.pearsoncomputing.net/ Please remember not to top-post: http://trinity.pearsoncomputing.net/mailing_lists/#top-posting
On Thursday 13 October 2011 12:39:50 Tiago Marques wrote:
I was interested in this problem. Regardless of whether it is a desktop or a laptop, mindless consumption of system resources is worth looking into.
Best regards, Tiago
--------------------------------------------------------------------- I am still awaiting a result from "Top" or "Htop". I actualy use "Top" because it's possible to space the "measures" of more than 10 seconds, which is not the case of "Htop". The tool should temporise, since the manipulation of windows eliminated the phenomenon. I will post when I have a result, if any.
I wonder if some user has already observed this phenomenon....
Good luck to everyone, Patrick

On Thursday 13 October 2011 12:39:50 Tiago Marques wrote:
I was interested in this problem. Regardless of whether it is a desktop or a laptop, mindless consumption of system resources is worth looking into.
Best regards, Tiago
I am still awaiting a result from "Top" or "Htop". I actualy use "Top" because it's possible to space the "measures" of more than 10 seconds, which is not the case of "Htop". The tool should temporise, since the manipulation of windows eliminated the phenomenon. I will post when I have a result, if any.
I wonder if some user has already observed this phenomenon....
Good luck to everyone, Patrick
I suspect what you saw may have been a transient Xorg glitch. If you can, try to reproduce the problem on a machine with a different graphics card (and therefore a different Xorg driver).
Tim
On Friday 14 October 2011 13:16:53 Timothy Pearson wrote:
I suspect what you saw may have been a transient Xorg glitch. If you can, try to reproduce the problem on a machine with a different graphics card (and therefore a different Xorg driver).
Tim
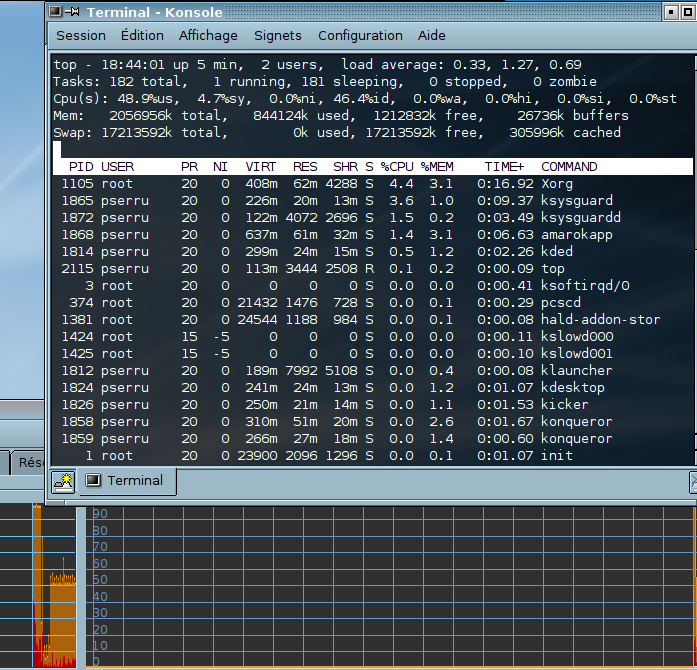
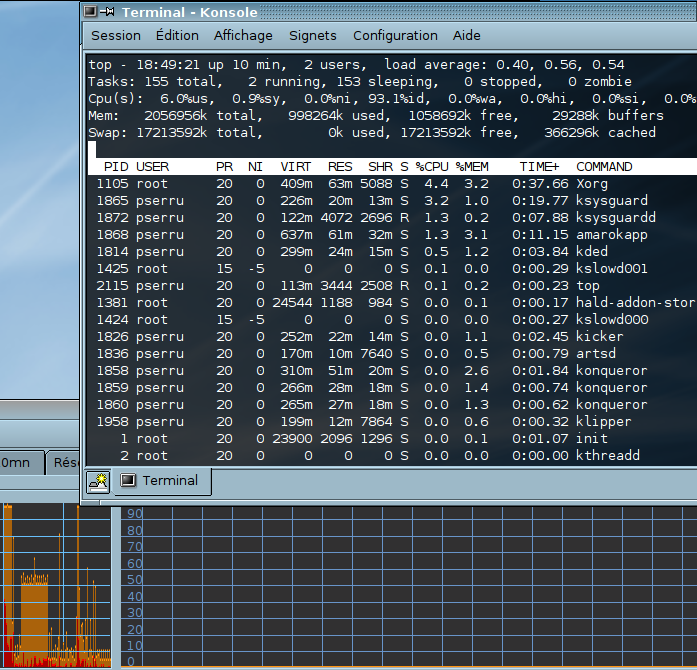
--------------------------------------------------------------------- I was about to join the opinion of Tim... So I spaced Ksysgard measures to 5 seconds (bottom left, 20sec for bottom right), and stated TOP to a an issue every 20 seconds. I waited, waited ... But luck at restart time (-: after the siesta). I give you the raw results, leaving you the fineness of the analysis.
Good luck to everyone, Patrick
On Sat, Oct 15, 2011 at 1:26 AM, Patrick Serru patrick@serru.net wrote:
On Friday 14 October 2011 13:16:53 Timothy Pearson wrote:
I suspect what you saw may have been a transient Xorg glitch. If you
can,
try to reproduce the problem on a machine with a different graphics card (and therefore a different Xorg driver).
Tim
I was about to join the opinion of Tim... So I spaced Ksysgard measures to 5 seconds (bottom left, 20sec for bottom right), and stated TOP to a an issue every 20 seconds. I waited, waited ... But luck at restart time (-: after the siesta). I give you the raw results, leaving you the fineness of the analysis.
The graphics have no legend and I can't find correspondence on mine. top seems fine. As suggested, you can also try htop. What am I missing?
Best regards
Good luck to everyone, Patrick
To unsubscribe, e-mail: trinity-users-unsubscribe@lists.pearsoncomputing.net For additional commands, e-mail: trinity-users-help@lists.pearsoncomputing.net Read list messsages on the Web archive: http://trinity-users.pearsoncomputing.net/ Please remember not to top-post: http://trinity.pearsoncomputing.net/mailing_lists/#top-posting

On Sat, 15 Oct 2011 04:37:00 +0100 Tiago Marques tiagomnm@gmail.com wrote:
On Sat, Oct 15, 2011 at 1:26 AM, Patrick Serru patrick@serru.net wrote:
On Friday 14 October 2011 13:16:53 Timothy Pearson wrote:
I suspect what you saw may have been a transient Xorg glitch. If you
can,
try to reproduce the problem on a machine with a different graphics card (and therefore a different Xorg driver).
Tim
I was about to join the opinion of Tim... So I spaced Ksysgard measures to 5 seconds (bottom left, 20sec for bottom right), and stated TOP to a an issue every 20 seconds. I waited, waited ... But luck at restart time (-: after the siesta). I give you the raw results, leaving you the fineness of the analysis.
The graphics have no legend and I can't find correspondence on mine. top seems fine. As suggested, you can also try htop. What am I missing?
There is one oddity--in the first screen shot, top shows ~50% CPU usage, but with no process using enough CPU to account for that. I suspect Patrick may have just missed capturing a shot which would have shown which process was responsible.
On Friday 14 October 2011 19:26:09 Patrick Serru wrote:
On Friday 14 October 2011 13:16:53 Timothy Pearson wrote:
I suspect what you saw may have been a transient Xorg glitch. If you can, try to reproduce the problem on a machine with a different graphics card (and therefore a different Xorg driver).
Tim
--------------------------------------------------------------------- How have I made these photos: I started the session normally. I started Top with 20 seconds between measurements. I looked at the display of Ksysgard, I had previously modified to sample every 5 seconds. Ho, chance: the system was in our case. I tried an "Alt + F2" to start Ksnapshot ... Chance again, the appearance of the command window did not "unlocked" the system. I waited. Just after a refresh of the display of Top, I pressed "Enter", happy to have photographed a rare bird. The only unexpected thing is that Ksnapshot was programmed to wait for 2 seconds. Of course, the launch of Ksnapshot broke the deadlock, and the second photo is nothing exeptional as is that of a "normal" situation.
I think it may be important to note that my system is outdated. My previous experience of updating Ubuntu resulted at least twice a complete reinstallation of the system after hours lost for download and hard to reboot. I prefer to keep the system functioning as it is now. The basic system is what's on the DVD "10/10 kubuntu-trinity-enterprise" downloaded 8/26/2011.
Good luck to everyone, Patrick
Le lundi 10 octobre 2011, Patrick Serru a écrit :
Hello everybody,
I always have a window "ksysgard" in my session. I noticed something that looks like a bug: the system consumes "abnormally", but not always. I was not able to cause the problem for sure. I am relatively sure it's related to KMail. Once opened and closed KMail. The only window "KSysgard" is open.
...
System kubuntu 10.10-trinity-enterprise (86x_64)
Good luck to everyone, Patrick
----------------------- Hi Everybody,
I had to install Linux on one of my wife's computer. It is a (suposed) six month old desktop computer, prety done, the mark is "Renovo" (never eared about yhis mark, before). I used my "Kubuntu 10.10-trinity enterprise" DVD, downloaded 26/08/2011. Still very good for simple user. but IT IS NOT an 86x_64 version like I wrote in the previous post!. It installed correctly on this intel dual 32bits core system...
I saw again this consumption problem. Whent it begins there is always one of the cores that is 100% loaded. Until now, I did not find a way to stop that...
Cheers Patrick
-
 Calvin Morrison
 -
 E. Liddell
 -
 L0ner
L0ner -
 Patrick Serru
 -
 Sanne
Sanne -
 Tiago Marques
 -
 Timothy Pearson